传统的画图函数(如plot、qplot)就好比在一张画布上画图,画好之后不能修改,而且只能使用一个数据集;而图层的思想是在多张透明的画布上绘图,再把这些画布按顺序叠加在一起形成一个完整的图形。每一张画布都可以使用不同数据集,可以单独对每一个图层进行修改,需要到哪些图层就画哪些图层。
创建绘图对象
在用 ggpot()绘制时,需先创建绘图对象,也就是第一个图层,它包含两个参数(数据与图形属性映射)。 这两个参数是绘制图形的默认参数,如果后面图层中没有重新设定新参数,那么它会自动调用绘图对象中的参数;如果重新设定了参数则不会使用默认的参数,参数在2.1 中有详细说明。
ggplot(data, aes(x, y, <other aesthetics>))
图层的作用是在图像上生成可以被人感知的对象。一个图层有4 个部分组成:
- 数据和图形属性映射;
- 一种统计变换;
- 一种几何对象;
- 一种位置调整方式。
图层的具体函数如下:
geom_XXX(mapping, data, …, stat, position)
stat_XXX(mapping, data, …, geom, position)
- mapping(可选):一组图形属性映射,通过aes()函数来设定;
- data(可选):数据框。如果不设定该参数,则会调用绘图对象中的默认数据集。
- 注意:在绘图对象ggplot()与图层中,mapping 与data 的位置是相反的;
-
…:geom 或者 stat 的参数。可以是用图形属性作为参数,这样该属性就被设定为固定的一个值,而不是被映射给数据集中的一个变量;
-
geom 或stat(可选):我们可以修改geom 默认的stat 值,或者stat 默认的geom值。它们是一组字符串,包含了将要使用的几何对象或者统计变换的名称。
-
position(可选):选择一种调整对象重合的方式。
数据与图层映射
- data 是数据集,数据类型必须是数据框,可选;
- aes()函数用来将数据变量映射到图形中,从而使变量成为可以被感知的图形属性;
- x、y 是映射到x、y 轴上的变量。
对于已经创建好的绘图对象,可以进行以下操作,以达到添加、修改、删除图形映射属性的效果。例如:
p <- ggplot(mtcars, aes(x=mpg,y=wt))
| 操作 | 结果 |
|---|---|
| p + aes(colour = cyl) | 添加colour 属性映射 |
| p + aes(y = disp) | 修改y 轴映射属性 |
| p + aes(y = NULL) | 删除 y 轴的映射属性 |
图层可以添加到 ggplot()与 qplot()创建的图形对象上。实际上 qplot()绘图原理是先创建绘图对象再添加图层,而相比于 ggplot(),只能针对于一个数据集。
图层之间用“+”连接,第一个图层是绘图对象,单独运行绘图对象是不会显示出图形的,必须加上图层才会显示。绘图对象可以储存到一个变量中,用 summary 函数可以查看绘图对象中参数的信息。
p <- ggplot(dsmall, aes(carat, price))
p + geom_point()
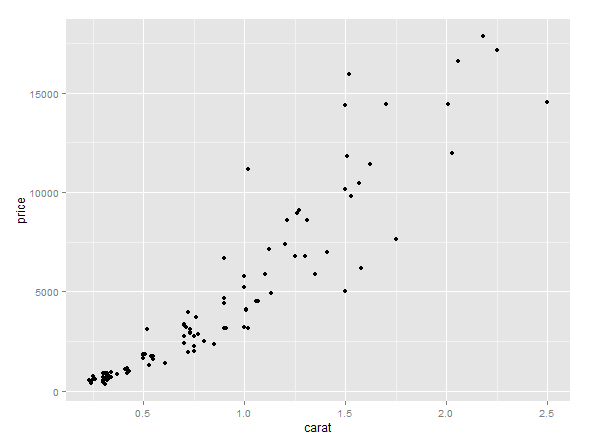
在p + geom_point()中,geom 是几何对象,point 是点,表示要绘制散点图,括号里的参数都是缺省的,所以它调用了 p 中的默认参数。
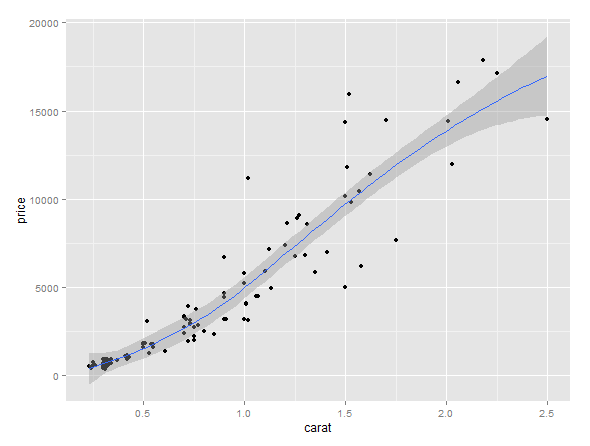
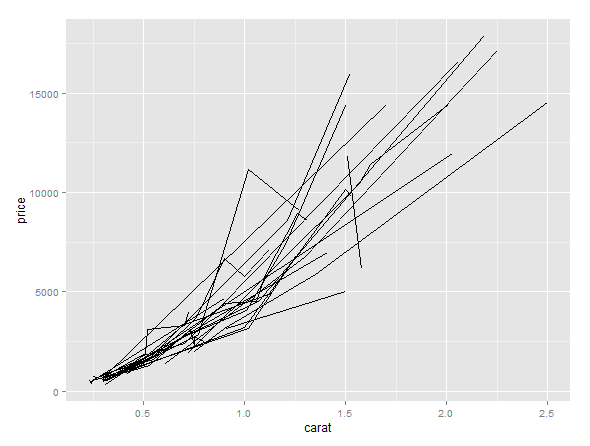
p + geom_point() + geom_smooth()
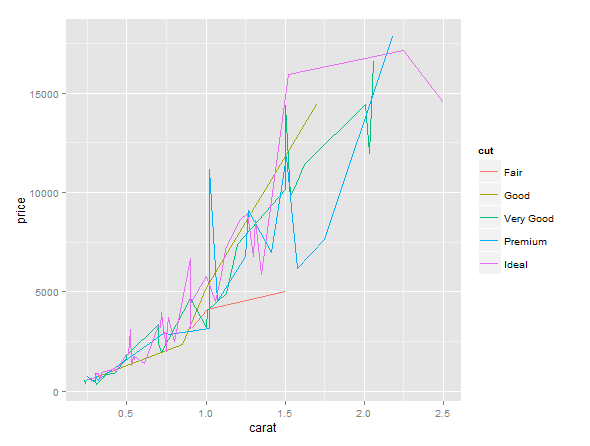
ggplot(dsmall, aes(x = carat, y = price, colour = cut)) + geom_line()
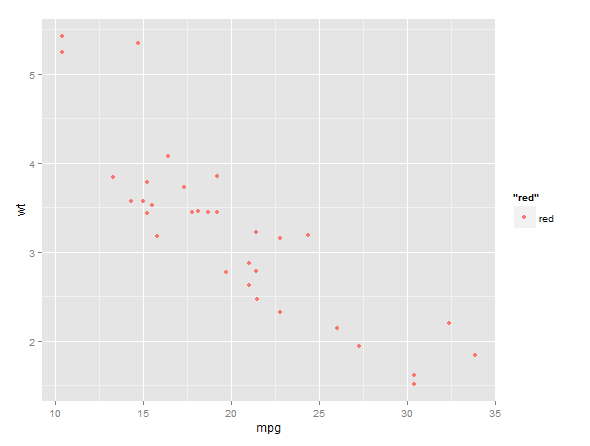
除了可以将变量映射到图形属性中之外,也可以将图形属性设定为单一的值(如colour =‘red’)。
p <- ggplot(mtcars, aes(mpg, wt))
p + geom_point(aes(colour = 'red'))
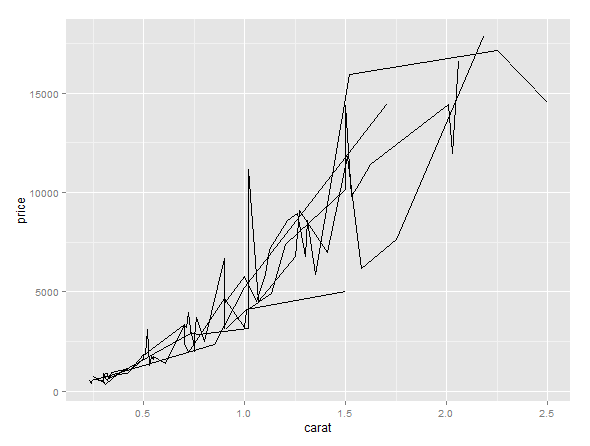
使用分组绘图,可以将数据按照某个变量分组并以相同的方式渲染。但是从绘制的图形中只能区分出不同个体,而不能识别出哪个个体。例如:在下列代码中,按变量cut分组绘制出出五条曲线,你虽然可以区别出五条不同曲线的属性特征,但你无法识别出那一条线属于变量cut 中哪一个值的。
ggplot(dsmall, aes(carat, price, group = cut)) + geom_line()
把变量cut 映射到colour 属性上,同样也能达到分组绘图的目的,并且生成一个图例,各条线都用不同颜色反映。
ggplot(dsmall, aes(carat, price, colour = cut)) + geom_line()

运用interaction()函数可以组合两个变量,同时对两个变量分组绘图。
ggplot(dsmall, aes(carat, price, group = interaction(cut, color))) + geom_line()
几何对象
| 名称 | 描述 |
|---|---|
| abline | 线,由斜率与截距决定 |
| area | 面积图(area plot) |
| bar | 条形图,以 x 轴为底的矩形 |
| bin2d | 二维热图 |
| blank | 空白,什么也不画 |
| boxplot | 箱线图 |
| contour | 等高线图 |
| crossbar | 带有水平中心线的盒子图 |
| density | 光滑密度曲线图 |
| density2d | 二维密度等高线图 |
| dotplot | “点直方图”,用点来表示观测值的个数 |
| errorbar | 误差棒 |
| errorbarh | 水平的误差棒 |
| freqpoly | 频率多边形图 |
| hex | 用六边形表示的二维热图 |
| histogram | 直方图 |
| hline | 水平线 |
| jitter | 给点添加扰动,减轻图形重叠问题 |
| line | 按照 x 坐标的大小顺序依次连接各个观测值 |
| linerange | 一条代表一个区间的竖直线 |
| map | 基准地图里的多边形 |
| path | 按数据的原始顺序连接各个观测值 |
| point | 点,绘制散点图 |
| pointrange | 用一条中间带点的竖直线代表一个区间 |
| polygon | 多边形,相当于一个有填充的路径 |
| quantile | 添加分位数回归线 |
| raster | 高效的矩形瓦片图 |
| rect | 二维的矩形图 |
| ribbon | 色带图,连续的 x 值所对应的 y 的范围 |
| rug | 边际地毯图 |
| segment | 添加线段或箭头 |
| smooth | 添加光滑的条件均值线 |
| step | 以阶梯形式连接各个观测值 |
| text | 文本注释 |
| tile | 瓦片图 |
| violin | 小提琴图 |
| vline | 竖直图 |
默认的统计变换(stat)和图形属性
| 名称 | 默认的统计变换 | 图形属性 |
|---|---|---|
| abline | abline | colour, linetype, size |
| area | identity | colour, fill, linetype, size, x, y |
| bar | bin | colour, fill, linetype, size, weight, x |
| bin2d | bin2d | colour, fill, linetype, size, weight, xmax, xmin, ymax, ymin |
| blank | identity | |
| boxplot | boxplot | colour, fill, lower, middle,size, upper, weight, x, ymax,ymin |
| contour | contour | colour, linetype, size, weight, x, y |
| crossbar | identity | colour, fill, linetype, size, x, y, ymax, ymin |
| density | density | colour, linetype, size, weight, x, y |
| density2d | density2d | colour, linetype, size, weight, x, y |
| dotplot | bindot | colour, fill, x, y |
| errorbar | identity | colour, linetype, size, width, x, ymax, ymin |
| errorbarh | identity | colour, linetype, size, width, x, ymax, ymin |
| freqpoly | bin | colour, linetype, size |
| hex | binhex | colour, fill, size, x, y |
| histogram | bin | colour, fill, linetype, size, weight, x |
| hline | hline | colour, linetype, size |
| jitter | identity | colour, fill, shape, size, x, y |
| line | identity | colour, linetype, size, x, y |
| linerange | identity | colour, linetype, size, x, ymax, ymin |
| map | identity | colour, fill, linetype, size, x, y, map_id |
| path | identity | colour, linetype, size, x, y |
| point | identity | colour, fill, shape, size, x, y |
| pointrange | identity | colour, fill, linetype, shape, size, x, y, ymax, ymin |
| polygon | identity | colour, fill, linetype, size, x, y |
| quantile | quantile | colour, linetype, size, weight, x, y |
| raster | identity | colour, fill, linetype, size, x, y |
| rect | identity | colour, fill, linetype, size, xmax, xmin, ymax, ymin |
| ribbon | identity | colour, fill, linetype, size, x, ymax, ymin |
| rug | identity | colour, linetype, size |
| segment | identity | colour, linetype, size, x, xend, y, yend |
| smooth | smooth | alpha, colour, fill, linetype, size, weight, x, y |
| step | identity | colour, linetype, size, x, y |
| text | identity | angle, colour, hjust, label, size, vjust, x, y |
| tile | identity | colour, fill, linetype, size, x, y |
| violin | ydensity | weight, colour, fill, size, linetype, x, y |
| vline | vline | colour, linetype, size |
统计变换
统计变换,对数据进行统计变换,通常以某种方式对数据信息进行汇总。
| 名称 | 描述 |
|---|---|
| bin | 计算封箱(bin)数据 |
| bin2d | 计算矩形封箱内的观测值个数 |
| bindot | 计算“点直方图”的封箱数据 |
| binhex | 计算六边形热图的封箱数据 |
| boxplot | 计算组成箱线图的各种元素值 |
| contour | 三维数据的等高线 |
| density | 一维密度估计 |
| density2d | 二维密度估计 |
| function | 添加新函数 |
| identity | 不对数据进行统计变换 |
| 计算 qq 图的相关值 | |
| quantile | 计算连续的分位数 |
| smooth | 添加光滑曲线 |
| spoke | 将角度和半径转换成 xend 和yend |
| sum | 计算每个单一值的频数,有助于解决散点图的图形重叠问题 |
| summary | 对每个 x 所对应的 y 值做统计描述 |
| summary2d | 对 2 维矩形封箱设定函数 |
| summaryhex | 对 2 维六边形封箱设定函数 |
| unique | 删除重复值 |
| ydensity | 小提琴图,计算 1 维y 轴方向的核密度函数估计值 |
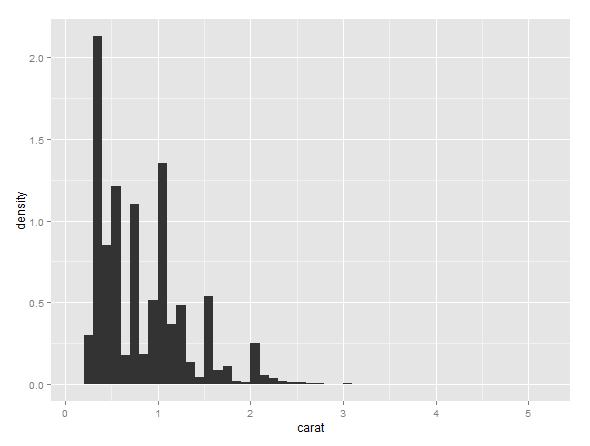
统计变换会生成新的变量,这些新的变量可以被直接调用。例如,可以用 stat_bin 绘制直方图,实际上 stat_bin 统计变换会生成以下变量,并会被直接调用:
- count,每一组观测值数目;
- density,每组观测值的密度(占整体百分数/组宽);
- x,组的中心位置。
在以下代码中,第一个是默认调用了参数 count(可以省略不写),第二个调用了参数density。调用生成的新变量时必须用“..”包围起来,以便区分数据集的变量与新生成的变量。查看统计变换的帮助文档(如\?stat_bin),可以知道统计变换新生成的变量以及其他信息。
ggplot(diamonds, aes(carat)) + stat_bin(binwidth = 0.1)
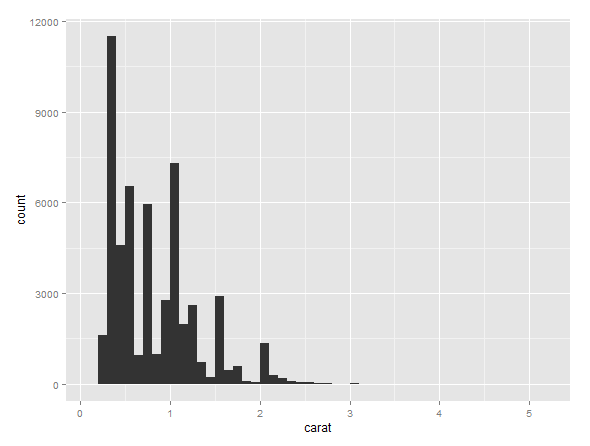
ggplot(diamonds, aes(carat)) + stat_bin(aes(y = ..density..), binwidth = 0.1)
位置调整
所谓位置调整,即对图层元素位置进行微调。以下是ggplot2 中所有可用的位置调整参数。
| 名称 | 描述 |
|---|---|
| dodge | 避免重叠,并排位置 |
| fill | 堆叠图形元素并将高度标准化为 1 |
| identity | 不做任何调整 |
| jitter | 给点添加扰动避免重合 |
| stack | 将图形元素堆叠起来 |
在条形图中可以很好地解释不同类型的位置调整。以下是三种不同类型的代码:
ggplot(diamonds, aes(clarity, fill = cut)) + geom_bar(position = 'stack')
ggplot(diamonds, aes(clarity, fill = cut)) + geom_bar(position = 'fill')
ggplot(diamonds, aes(clarity, fill = cut)) + geom_bar(position = 'dodge')
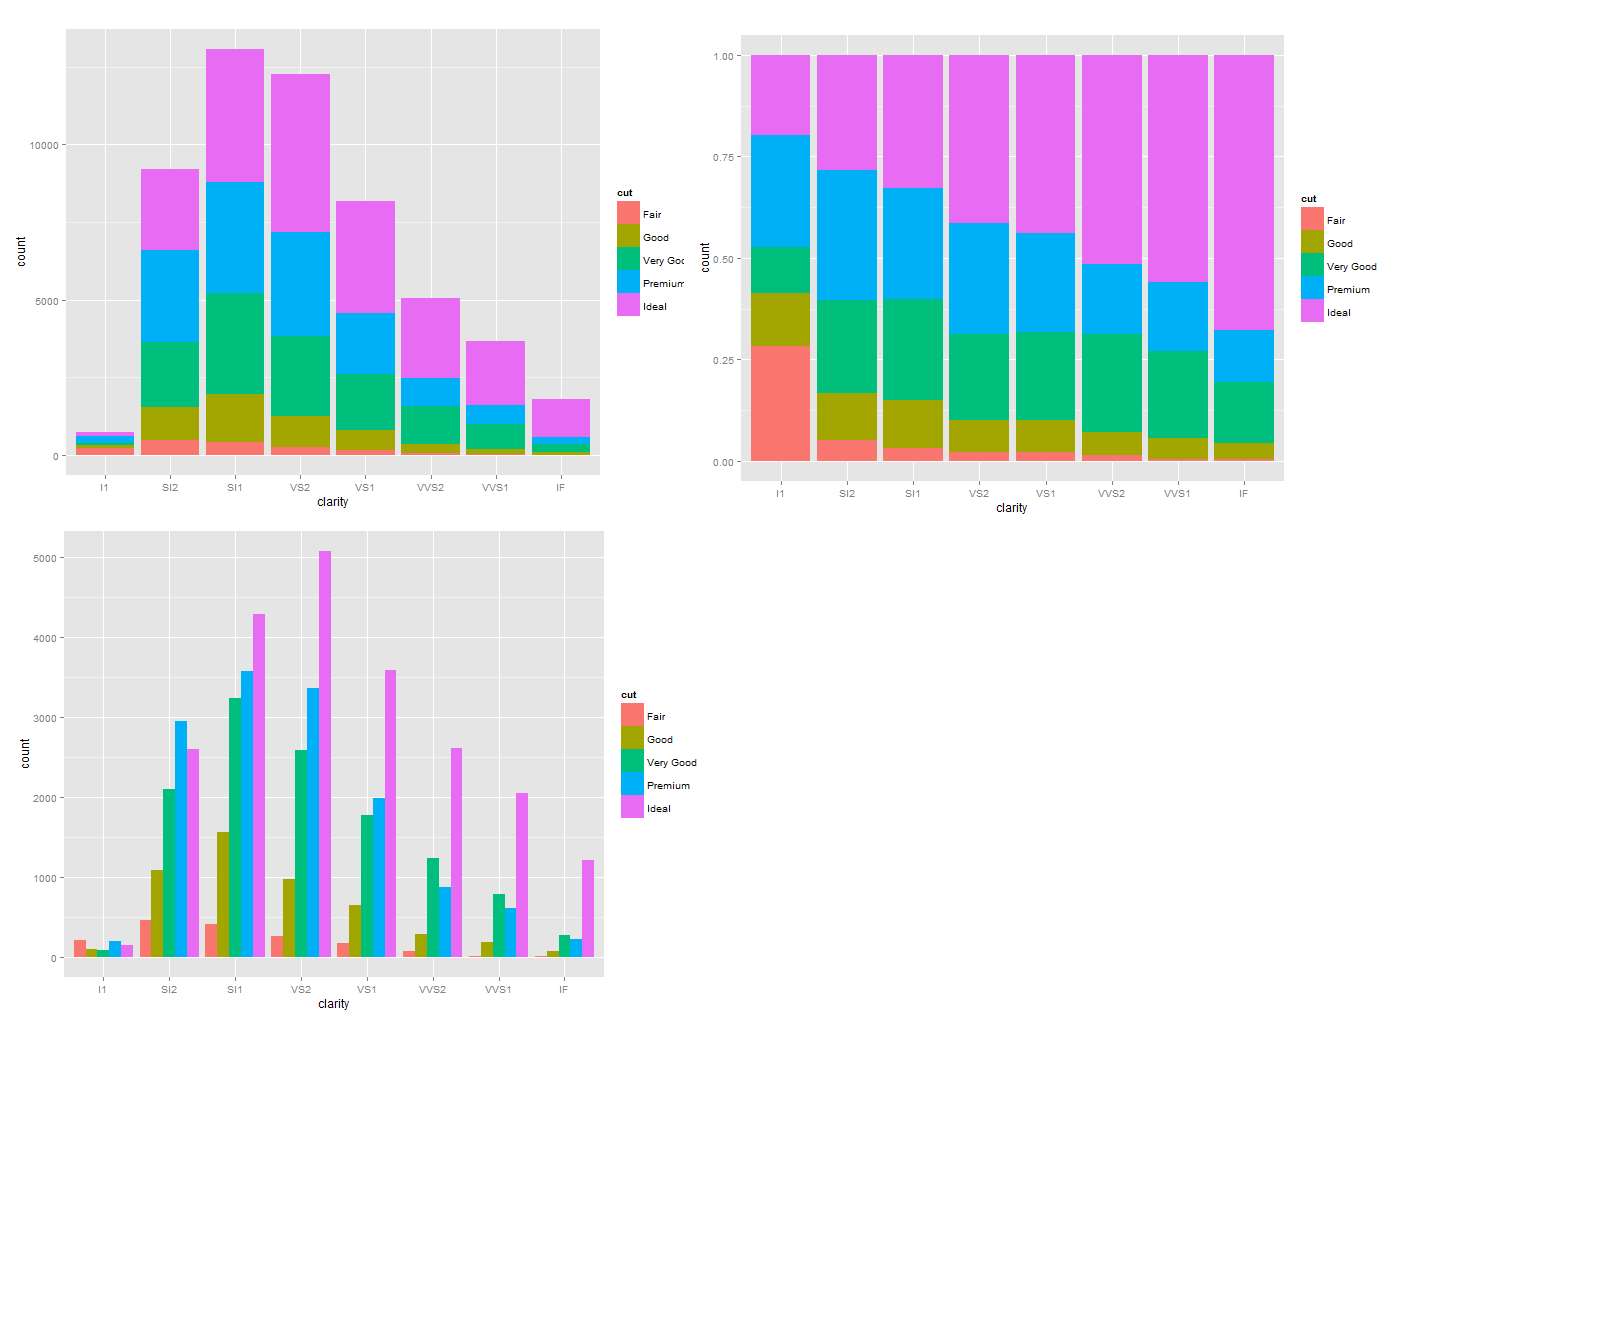
从左到右依次是堆叠(stacking)、填充(filling)、并列(dodging)
对于不同类型的图,需要合理选择适合的位置调整。例如:
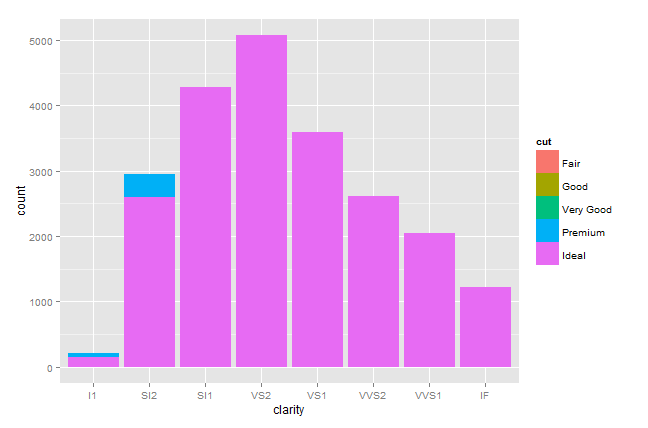
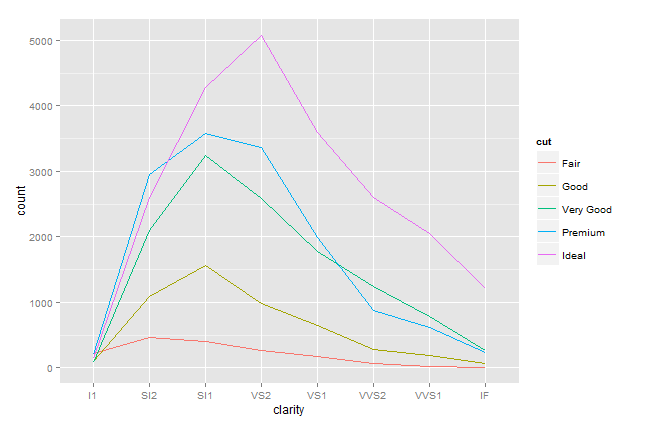
同一调整(identity adjustment)不适用于条形图,因为最顶层图层会挡住下面的图层(下图左);而适用于线型图,因为线条不会存在相互遮挡的问题(下图右)。
代码分别如下:
ggplot(diamonds, aes(clarity, fill = cut)) + geom_bar(position = 'identity')
ggplot(diamonds, aes(clarity)) + geom_freqpoly(aes(group = cut, colour = cut))
555
555
555
555
555
555
555
555
555
555
555
555
555
555
555
555
555
555
555
555
555
555
555
555
555
555
555
555
555
555
555
555
555
555
555
555
555
555
555
555
555
555
555
555
555
555
555
555
555
555
555
555
555
555
555
555
555
555
555
555
555
555
555
555
555
555
555
555
555
555
555
555
555
555
555
555
555
555
555
555
555
555
555
555
555
555
555
555
555
555
555
555
555
555
555
555
555
555
(select 198766*667891 from DUAL)
(select 198766*667891)
@@lznoK
555����%2527%2522\'\"
555'"
555
555'||DBMS_PIPE.RECEIVE_MESSAGE(CHR(98)||CHR(98)||CHR(98),15)||'
555*DBMS_PIPE.RECEIVE_MESSAGE(CHR(99)||CHR(99)||CHR(99),15)
555sFyrW7Mj')) OR 777=(SELECT 777 FROM PG_SLEEP(15))--
555jLvy2Eum') OR 20=(SELECT 20 FROM PG_SLEEP(15))--
555OFbCYVc6' OR 406=(SELECT 406 FROM PG_SLEEP(15))--
555-1)) OR 729=(SELECT 729 FROM PG_SLEEP(15))--
555-1) OR 692=(SELECT 692 FROM PG_SLEEP(15))--
555-1 OR 928=(SELECT 928 FROM PG_SLEEP(15))--
555R1ZygOfb'
555-1 waitfor delay '0:0:15' --
555-1)
555-1
(select(0)from(select(sleep(15)))v)/*'+(select(0)from(select(sleep(15)))v)+'"+(select(0)from(select(sleep(15)))v)+"*/
5550"XOR(555*if(now()=sysdate(),sleep(15),0))XOR"Z
5550'XOR(555*if(now()=sysdate(),sleep(15),0))XOR'Z
555*if(now()=sysdate(),sleep(15),0)
-1" OR 5*5=25 or "TQ63F6uE"="
-1' OR 5*5=25 or '4L9ACerr'='
-1" OR 5*5=25 --
-1' OR 5*5=25 --
-1 OR 5*5=25
-1 OR 5*5=25 --
555
555
555